Skip to content

Inside the platform Solaris runs

Solaris is a working solar business — a national installation network, a sales desk, a support queue, and thousands of monitored systems, all on the platform this app is built on. Eighteen screens from their own installer portal follow, in the order an installer meets them.

These captures come from a test environment, so every name, address and figure in them is sample data. What they show is the software itself — the screens, and the way one leads to the next.

The platform

One portal behind a single sign-on, carrying every function below.

One door in
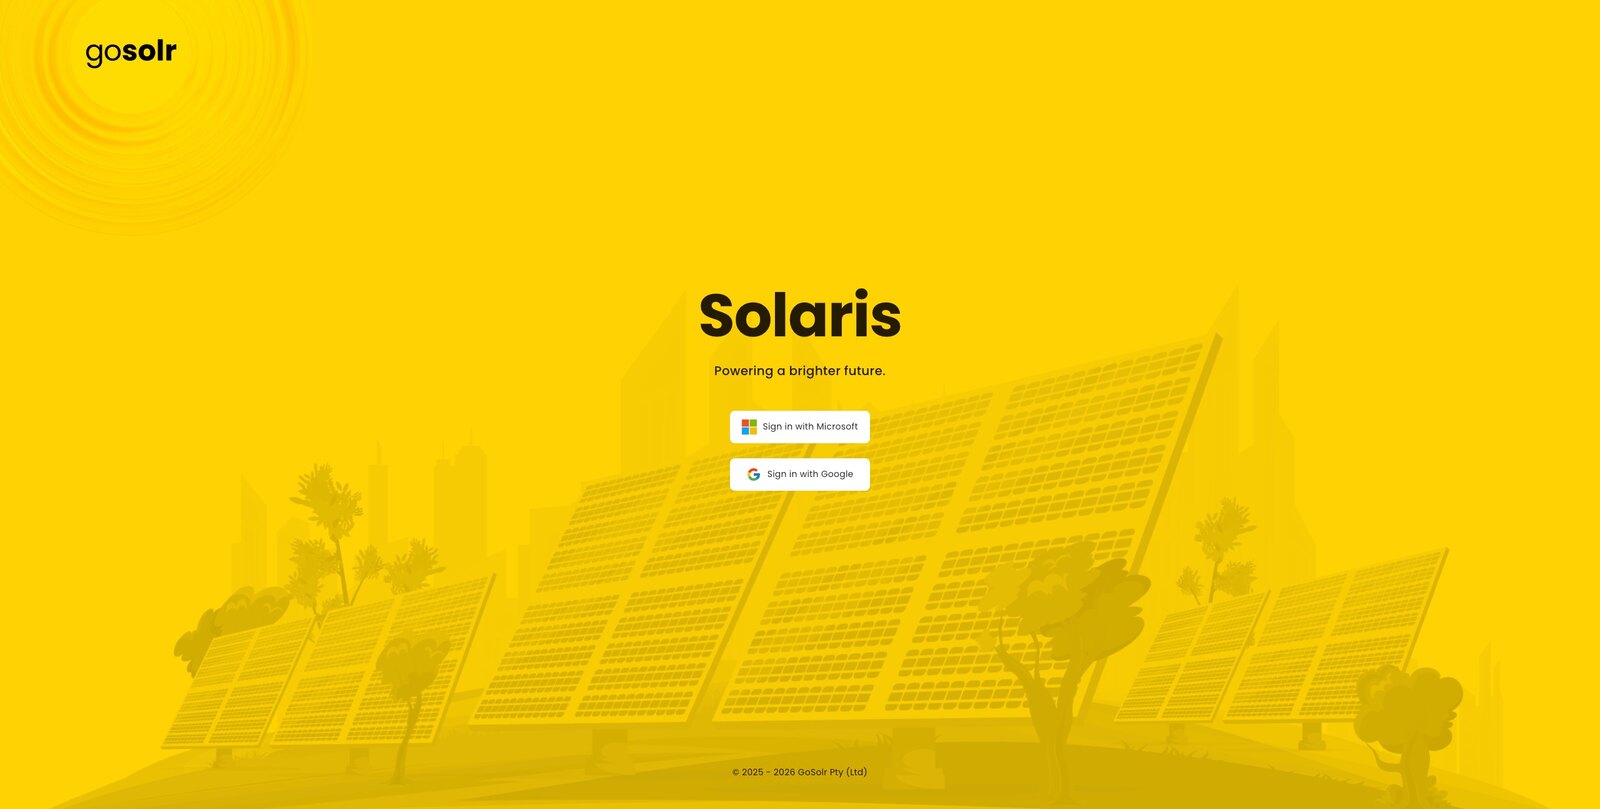
The Solaris sign-in screen: the product name over an illustration of solar panels, with Microsoft and Google sign-in buttons.
Staff sign in with the identity provider the business already runs. No separate password to manage or revoke.

Watching the fleet

Every installed system reports in continuously. This is what an installer sees before a client ever notices anything is wrong.

The whole fleet on one screen
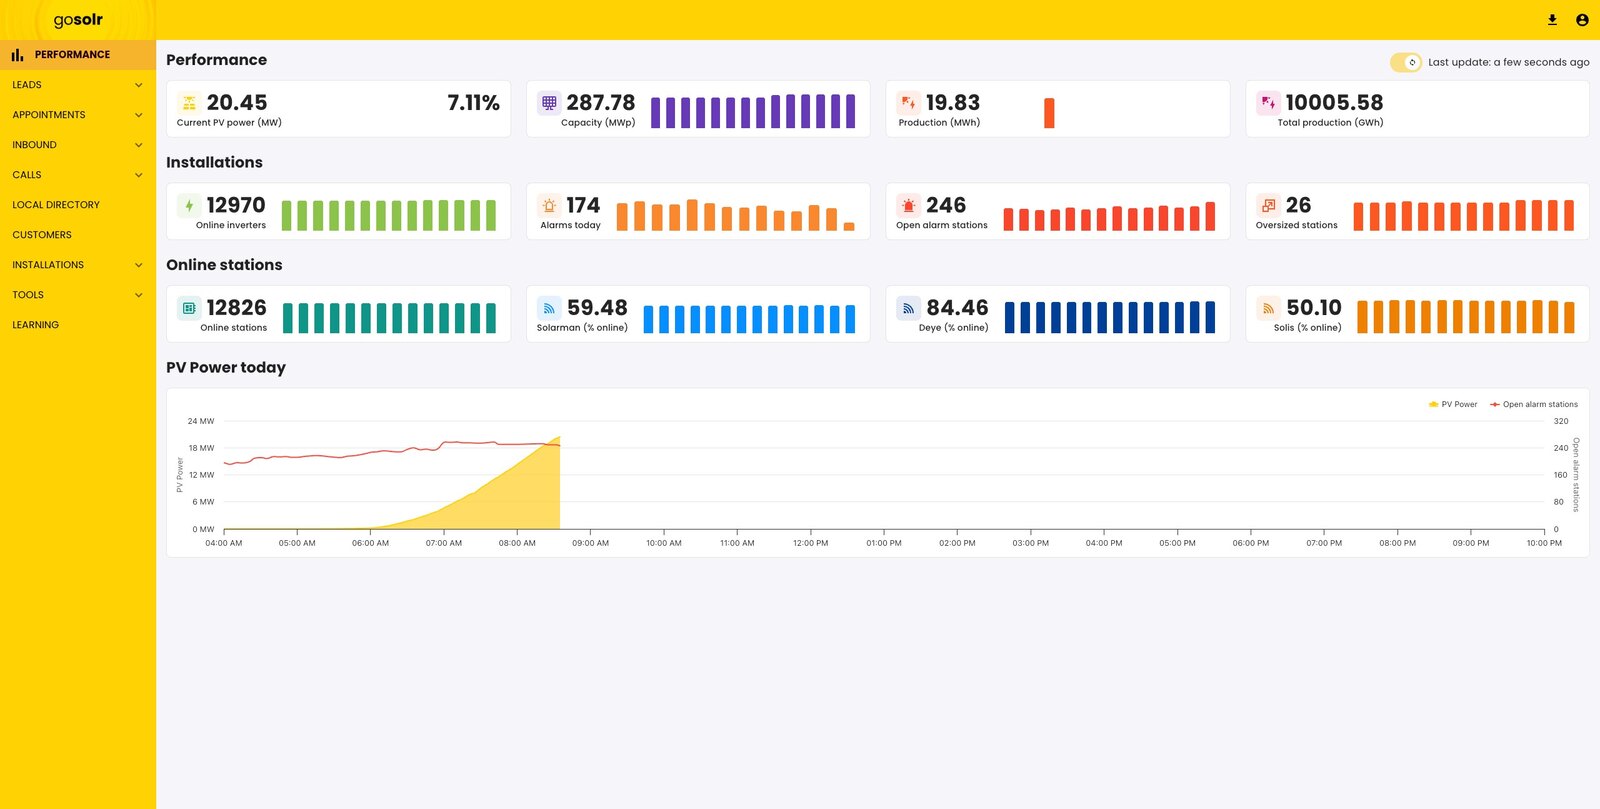
The fleet dashboard: tile rows for current PV power, capacity, production, online inverters, alarms and online stations, above a chart of fleet-wide PV power through the day.
Capacity, production and inverter health across every monitored system, over a live production curve with open alarms on the same axis.

Every system, searchable

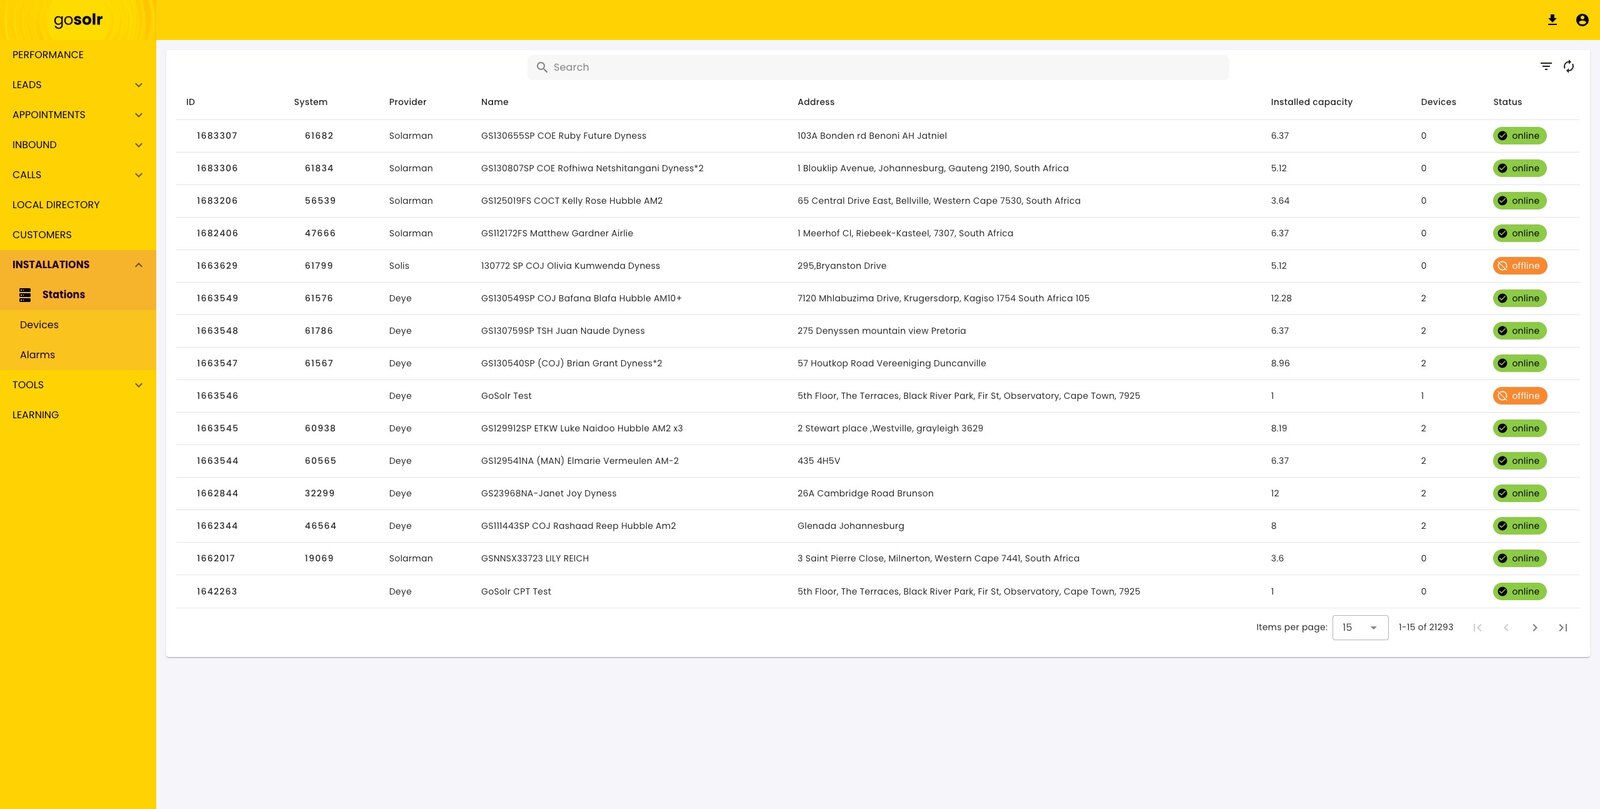
The stations list: rows of installations with provider, name, address, installed capacity, device count and an online or offline status pill.
The fleet as a list rather than a number — filtered, sorted, and paged, with each row carrying its own online state.

One system, in full

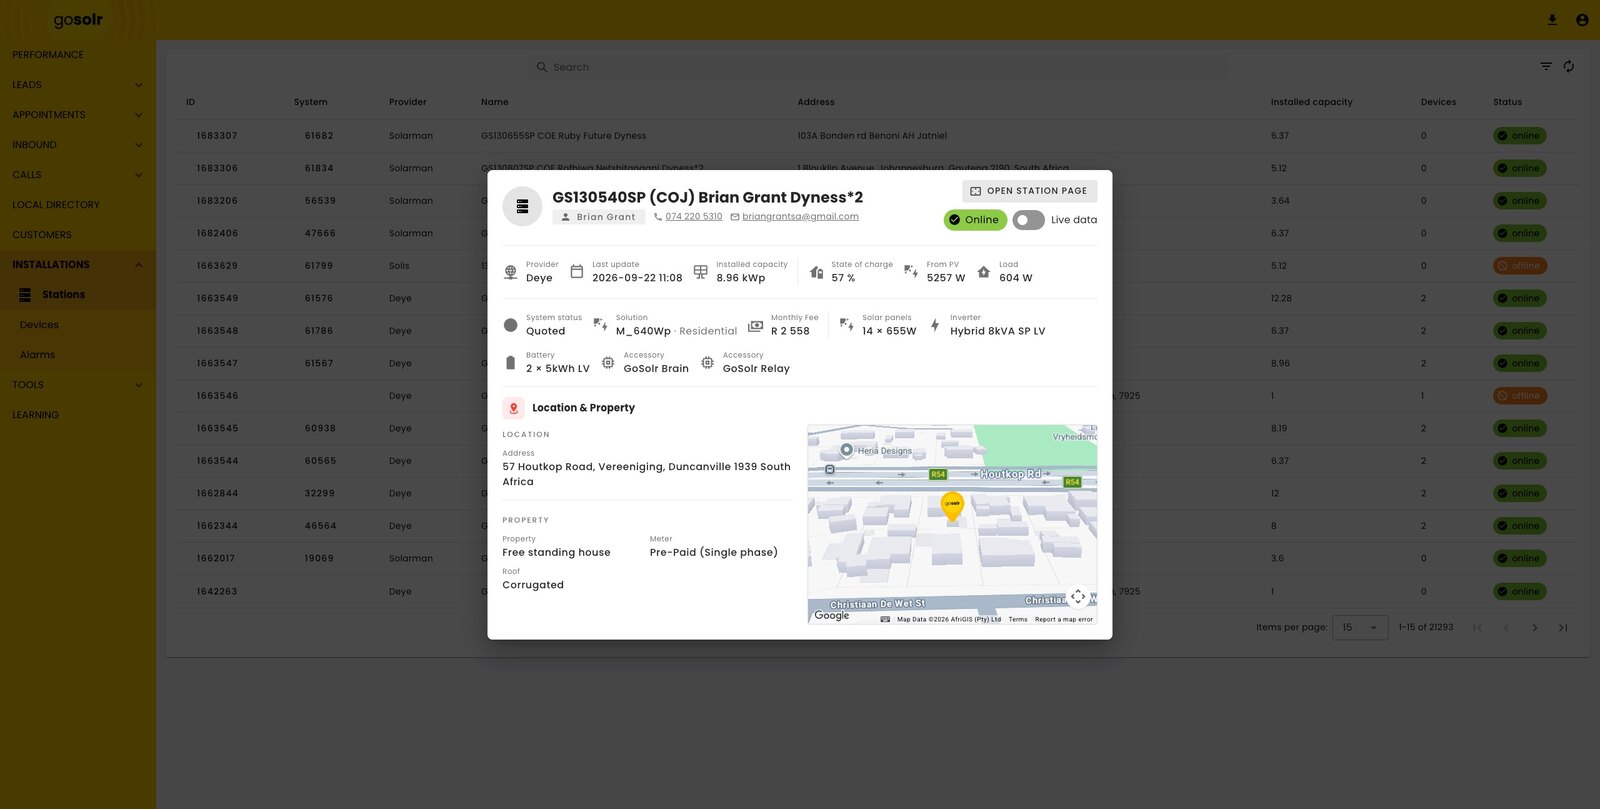
A station detail panel: live state of charge, PV input and load, alongside the installed hardware, monthly fee, address and a map.
Live telemetry, the hardware actually installed, and the commercial terms — on one panel, without leaving the list.

Faults surface before the client calls
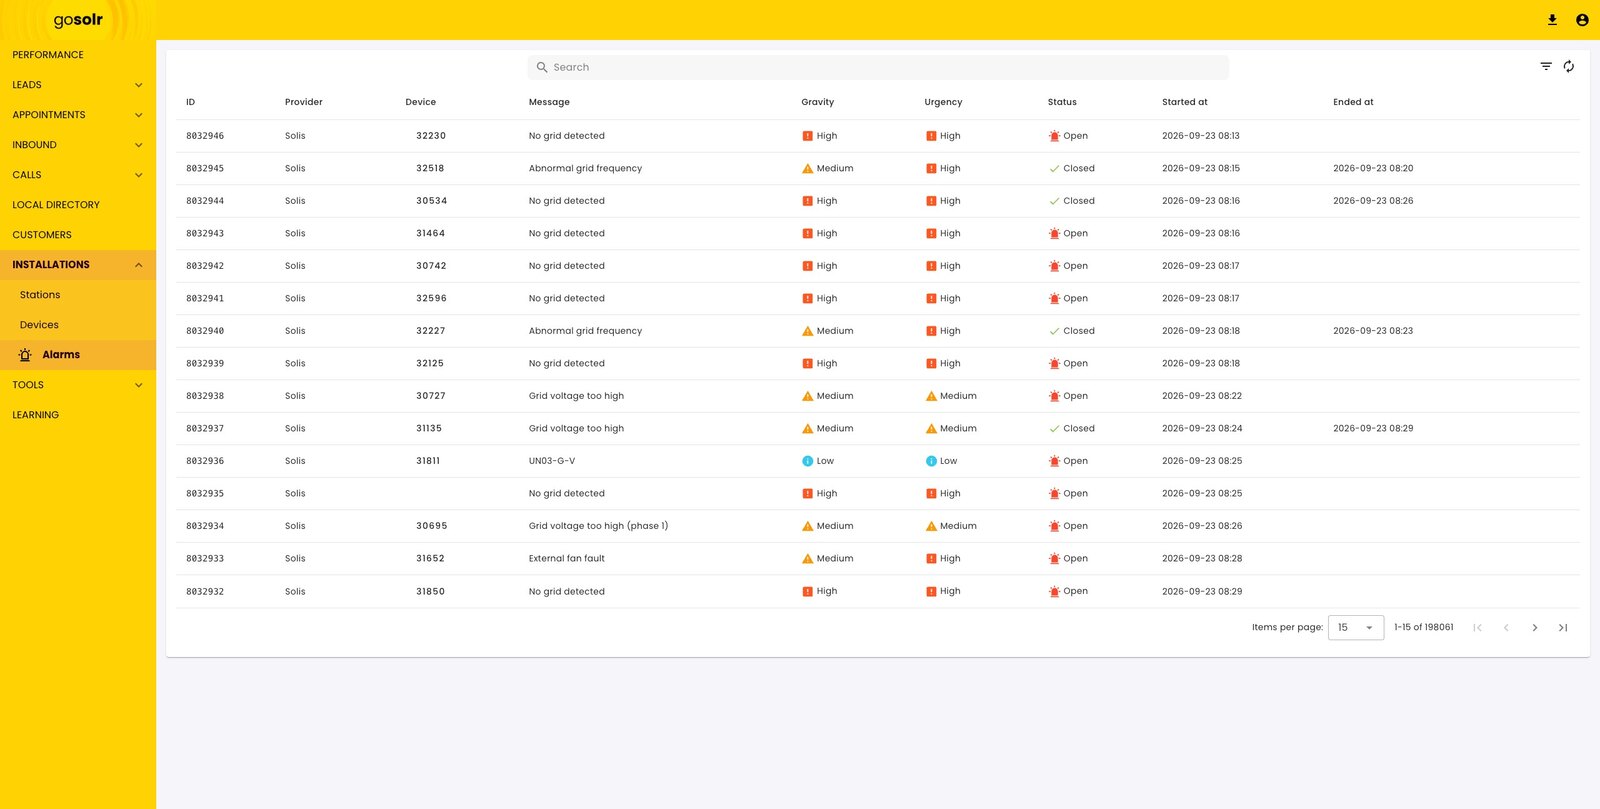
The alarm feed: rows of grid and hardware faults with severity, urgency, open or closed status, and start and end timestamps.
Grid faults, voltage excursions and hardware failures open a tracked alarm on detection and close themselves when the condition clears.

From first call to a qualified lead

The sales desk runs inside the same portal, and a lead is qualified on the call rather than after it.

The desk, live
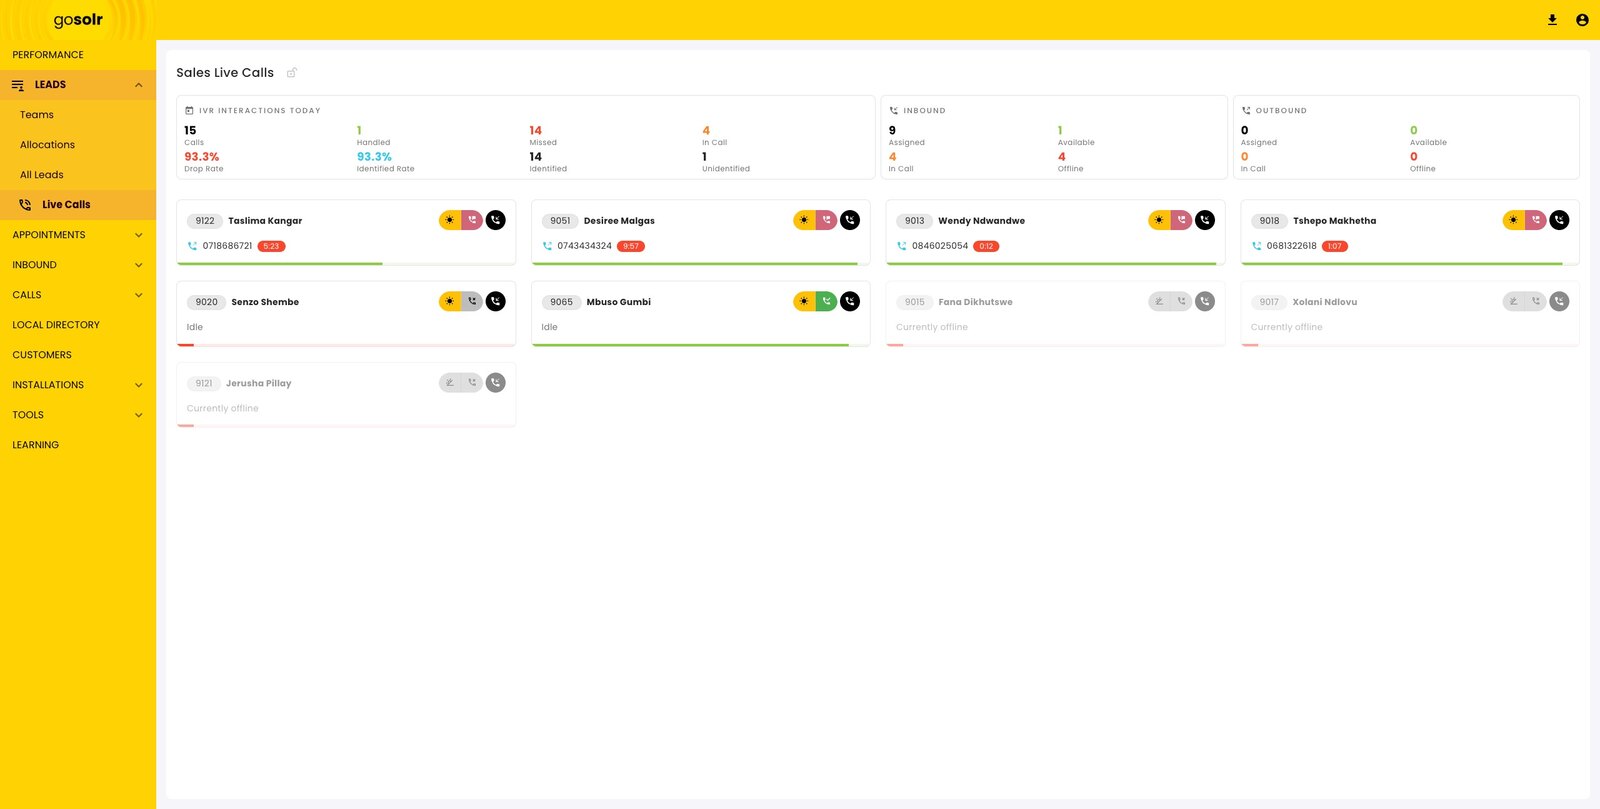
A live calls board: agent cards showing extension, status and call duration, above counters for handled, missed and identified calls.
Who is on a call, who is idle, who is offline — with the day’s drop rate and identification rate beside it.

The assessment, in four steps

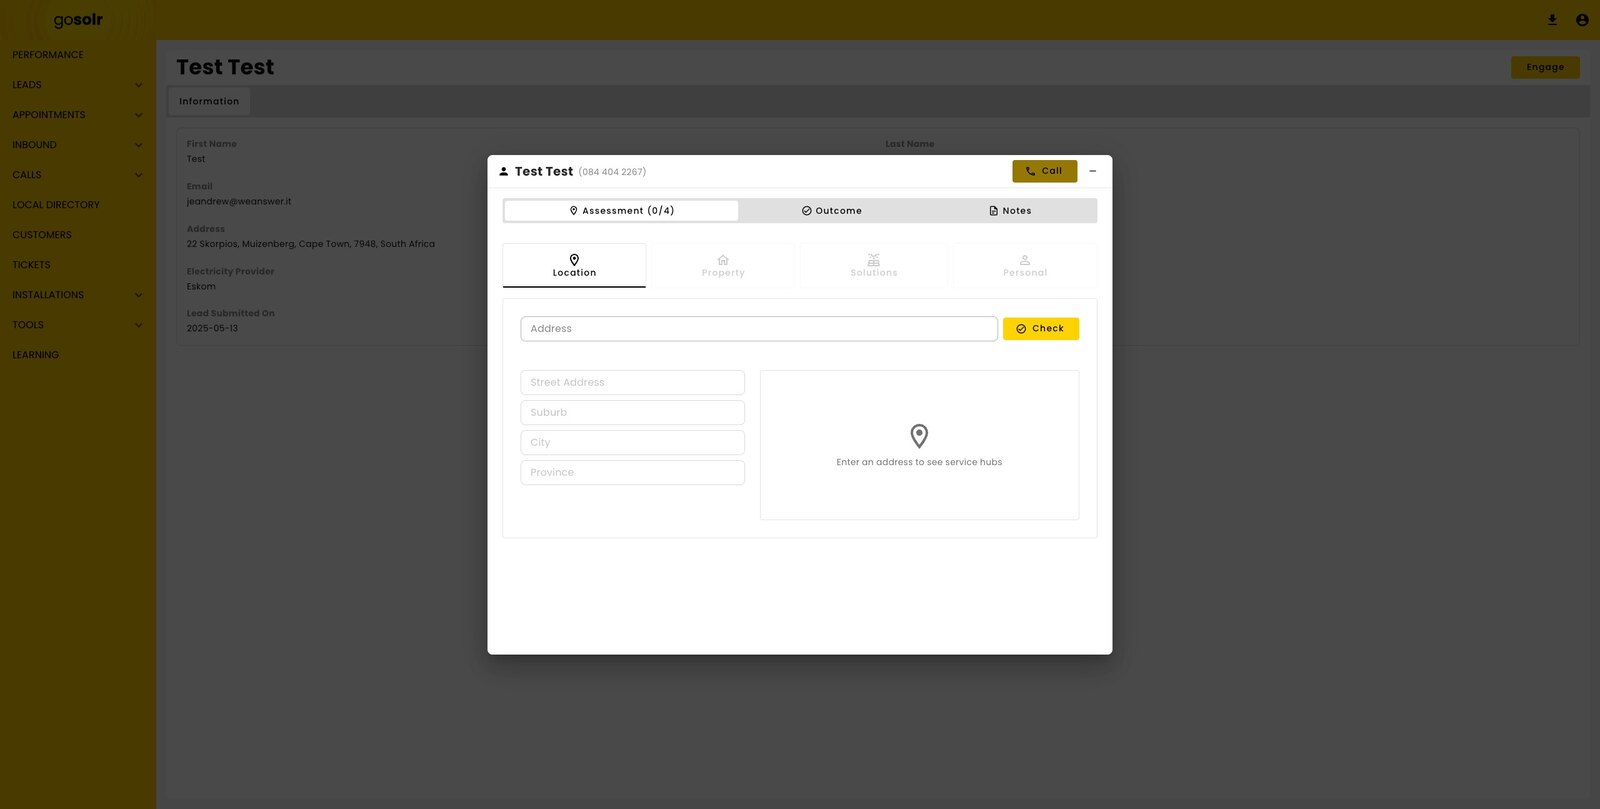
The lead assessment opening on step one of four, with Location, Property, Solutions and Personal tabs and an empty address field.
Location, property, solution, personal — the same four steps every time, so nothing is asked twice and nothing is missed.

Can we even get there?

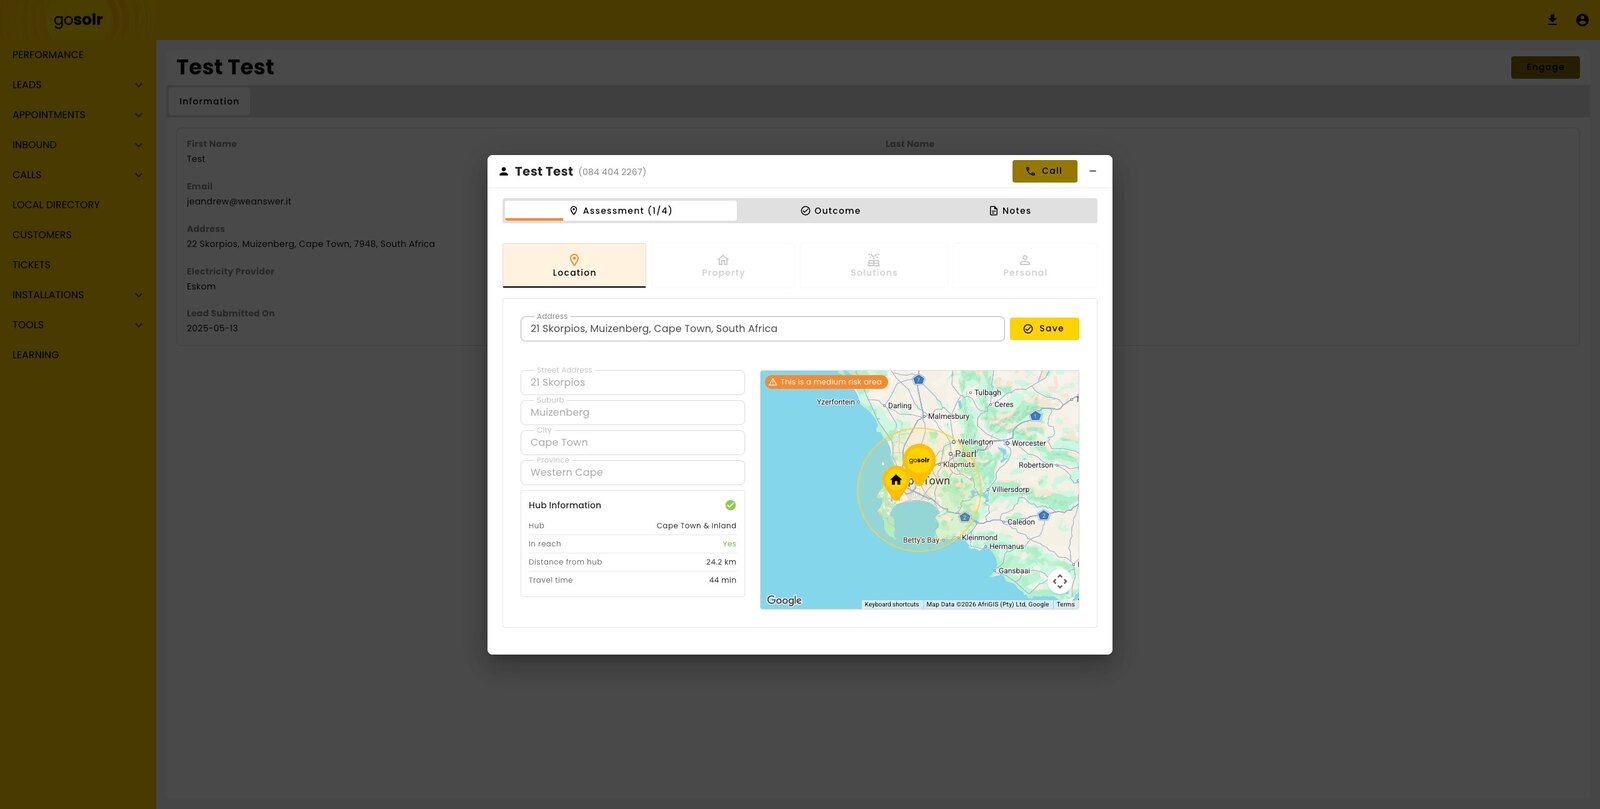
Step one of the assessment: an address resolved to suburb, city and province, beside a map showing the nearest service hub, its distance and travel time.
The address resolves to a hub, a distance and a travel time — and a risk flag if the area carries one. Out of reach is known now, not on the day.

Can a system go in?

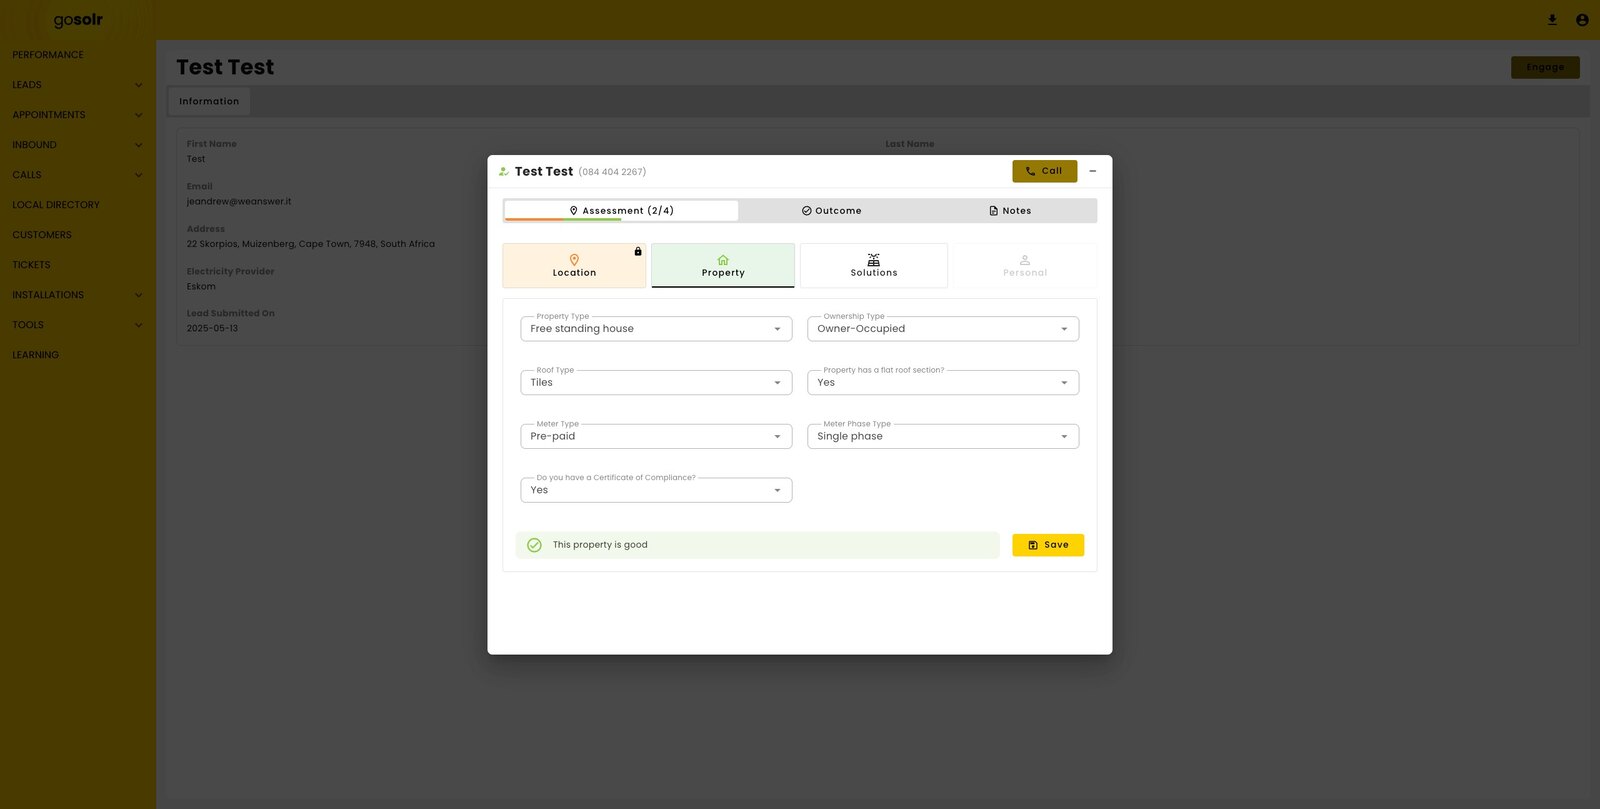
Step two of the assessment: dropdowns for property type, ownership, roof type, flat-roof section, meter type, meter phase and certificate of compliance, with a green “This property is good” result.
Roof, meter, ownership, compliance. The verdict lands on the same screen as the answers.

What it would cost

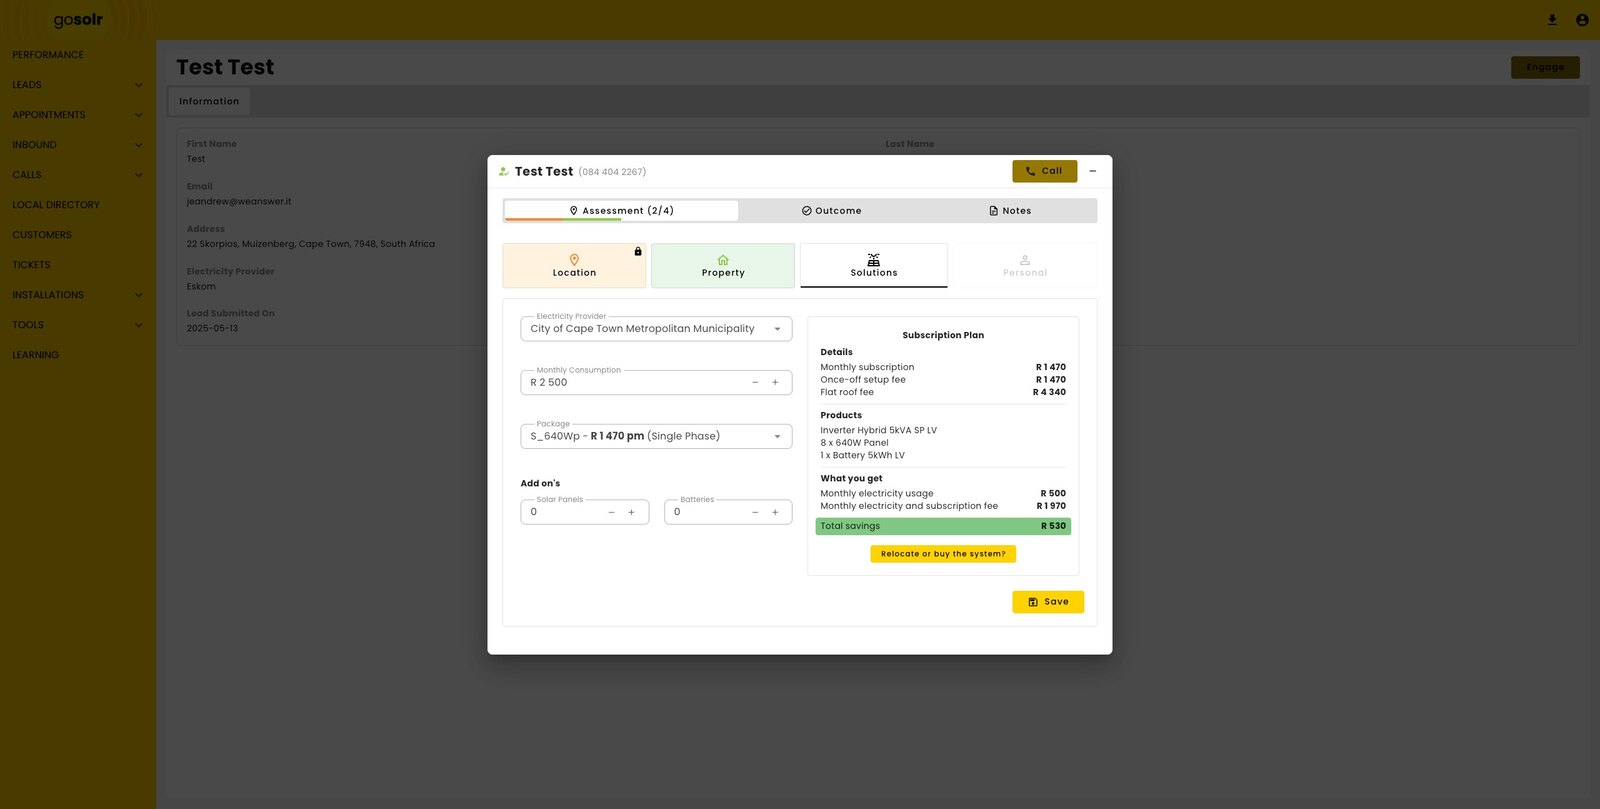
Step three of the assessment: electricity provider, monthly consumption and package inputs beside a subscription plan panel itemising fees, products and total monthly savings.
Consumption and package price the subscription live — hardware, setup, roof fee and the monthly saving, recalculated as the consultant changes an input.

Every call ends somewhere

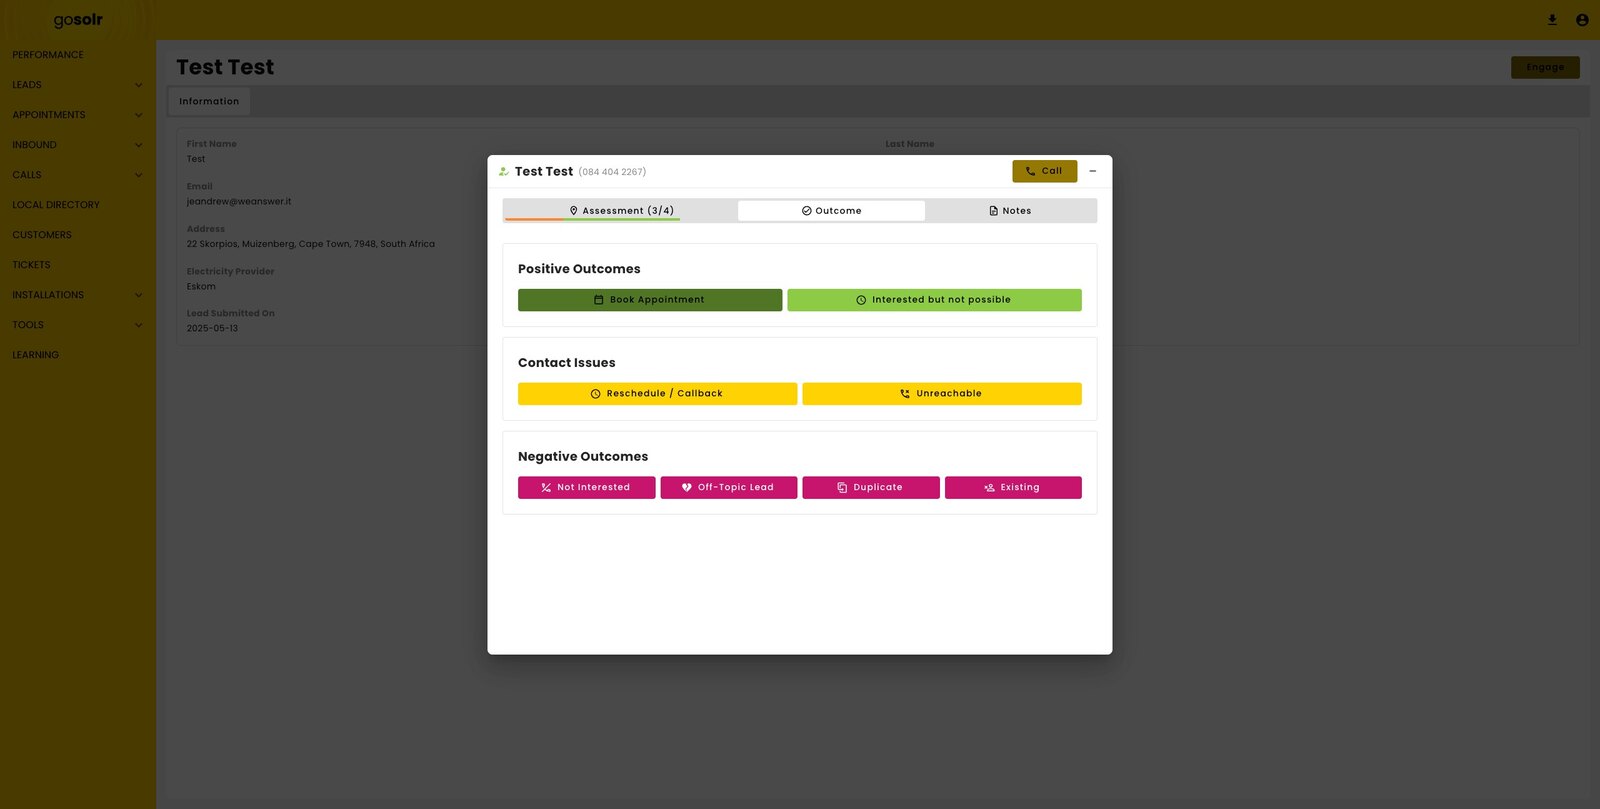
The assessment outcome step: buttons grouped under Positive Outcomes, Contact Issues and Negative Outcomes.
Booked, unreachable, not interested, duplicate — one of eight outcomes, always recorded, so the funnel measures itself.

Getting someone to the door

A booked appointment is a promise about a specific person arriving at a specific address. The portal plans it against real capacity.

The appointment, assembled
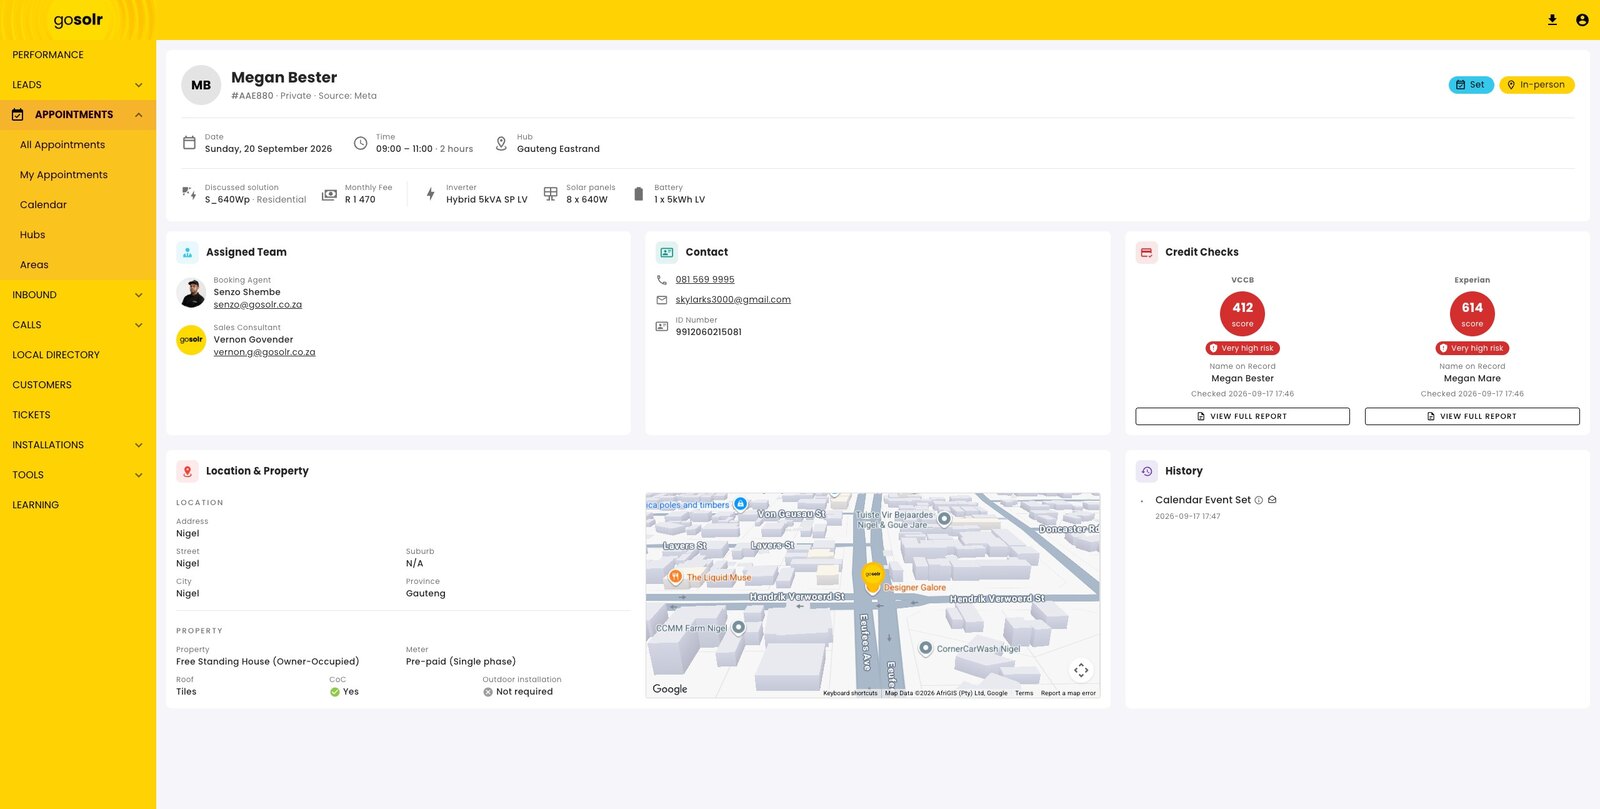
An appointment detail page: date, time and hub, the discussed solution and hardware, the assigned booking agent and sales consultant, contact details, credit-check scores, and the property with a map.
The solution discussed, the team assigned, the property, and the credit checks — gathered before anyone drives out.

A day across the whole team

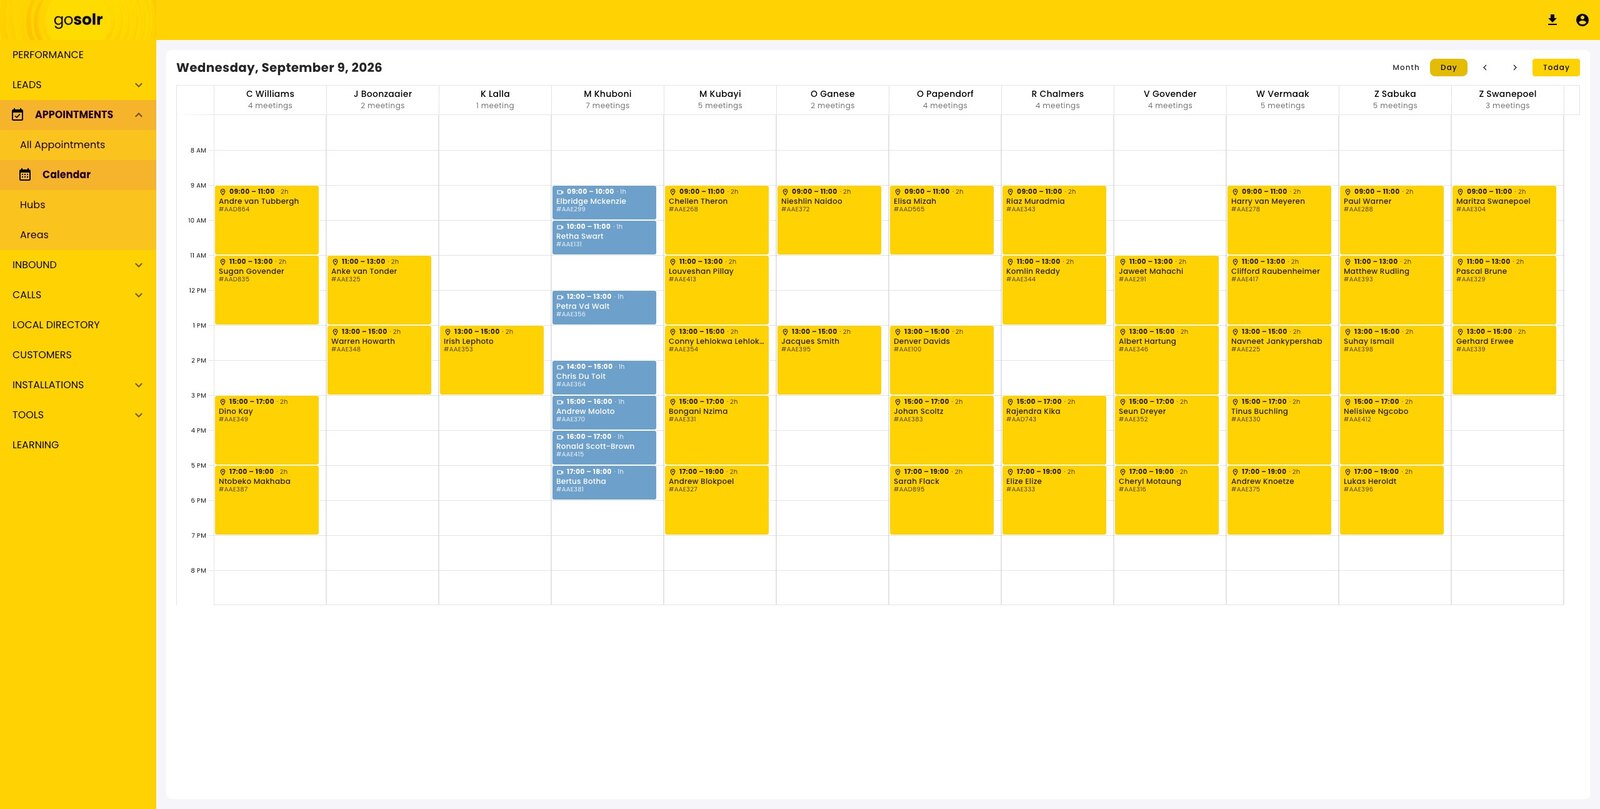
A day-view calendar with twelve consultant columns, each holding two-hour appointment blocks with a reference.
Twelve consultants, one day, in two-hour blocks — so a gap is visible and an overloaded column is too.

Twenty-five hubs, one map

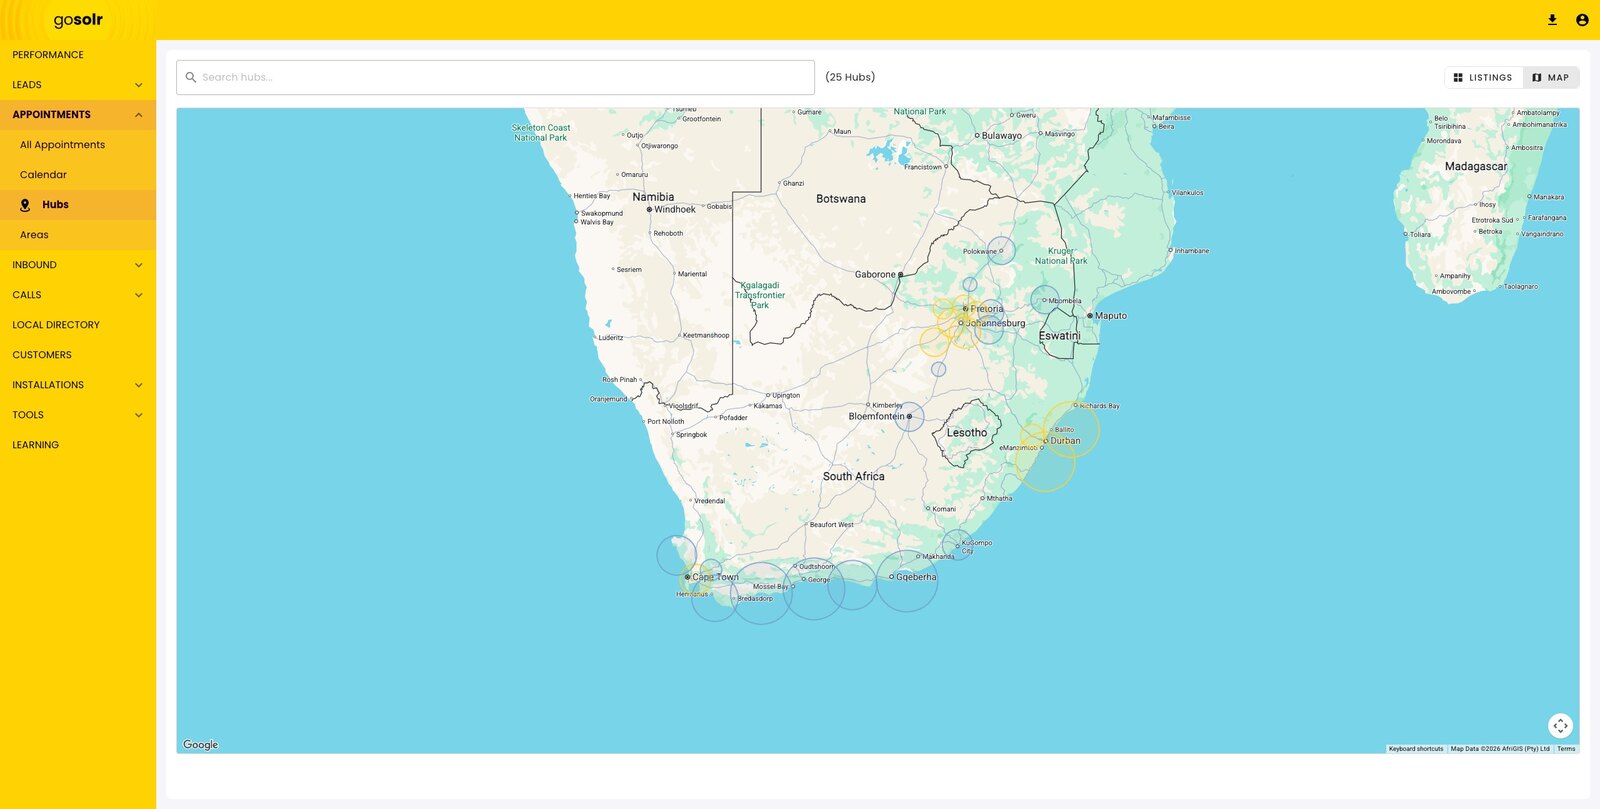
A map of southern Africa with shaded circles marking service-hub coverage areas around major centres.
Capacity is planned by hub, not by pin. Each circle is one hub’s working reach — the same reach the assessment checks an address against.

Sizing and pricing a system

A standalone tool for the harder question: not what this client asked for, but what they actually need.

What the household actually spends
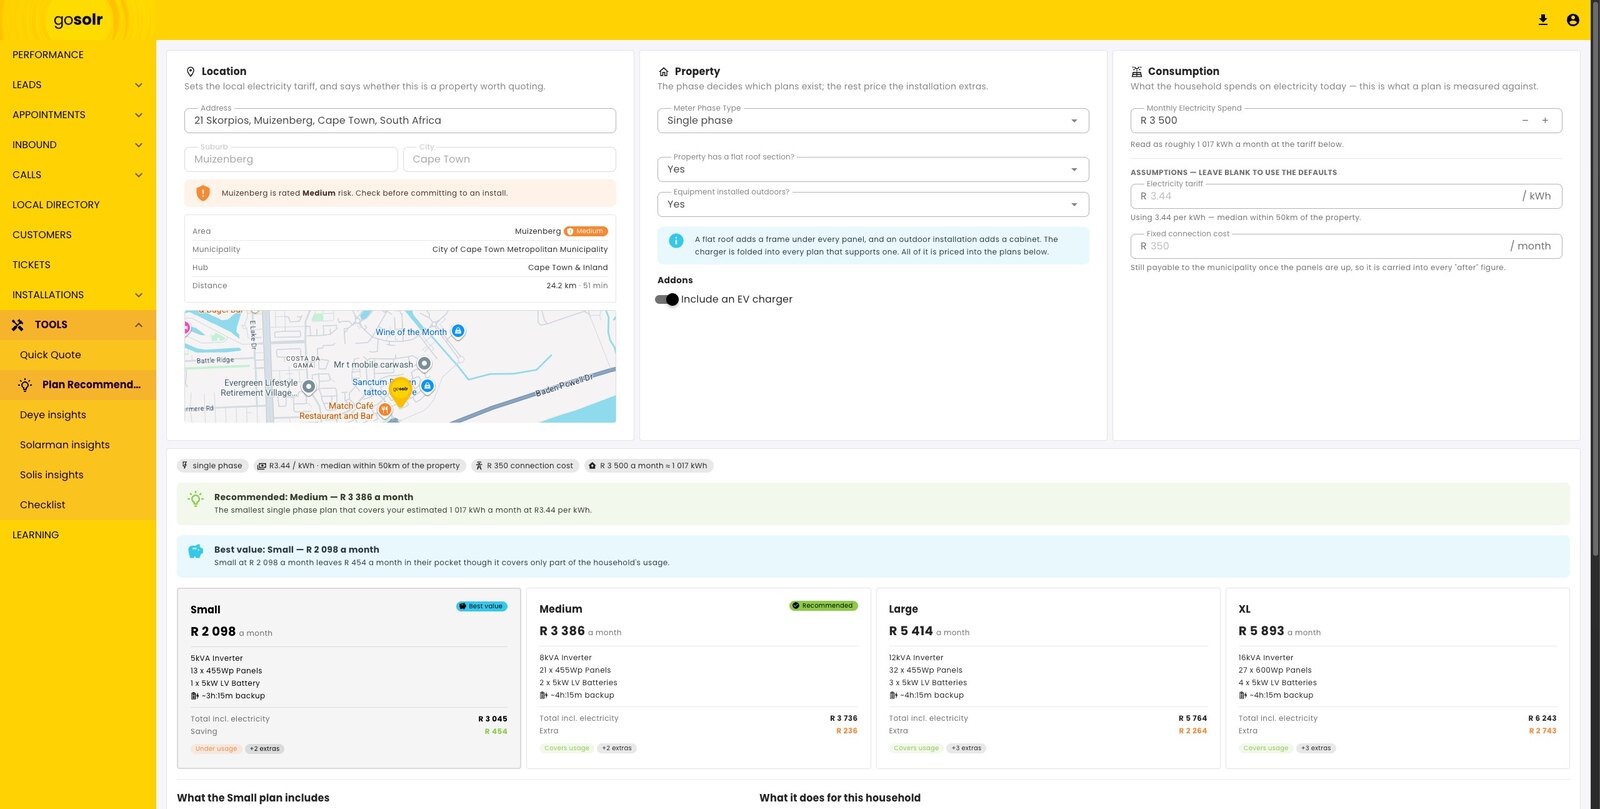
The plan recommendation tool: location with a tariff and risk rating, property questions, and monthly electricity spend with tariff and connection-cost assumptions.
Tariff comes from the location, the phase decides which plans exist, and the monthly bill becomes the number every option is measured against.

Four options, one recommendation

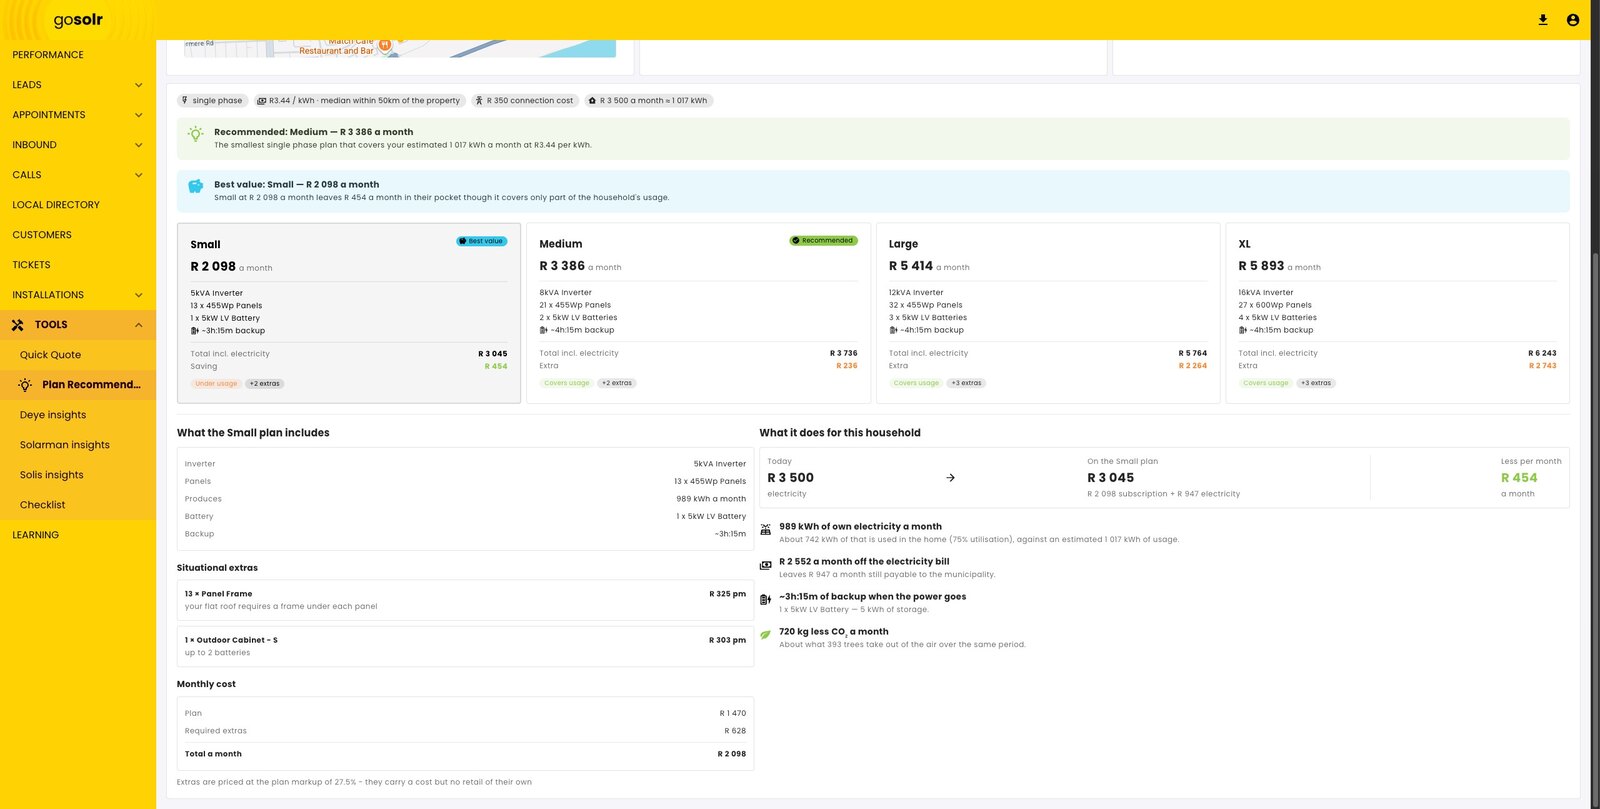
The plan recommendation result: Small, Medium, Large and XL tiers with monthly pricing and hardware, above a breakdown of what the recommended plan does for the household.
The cheapest plan that covers them, named — and what each one leaves in their pocket, in rand a month rather than percentages.

After the sale

The client record does not stop at the install. It carries every system, ticket, invoice and order for the life of the account.

Everything one client owns
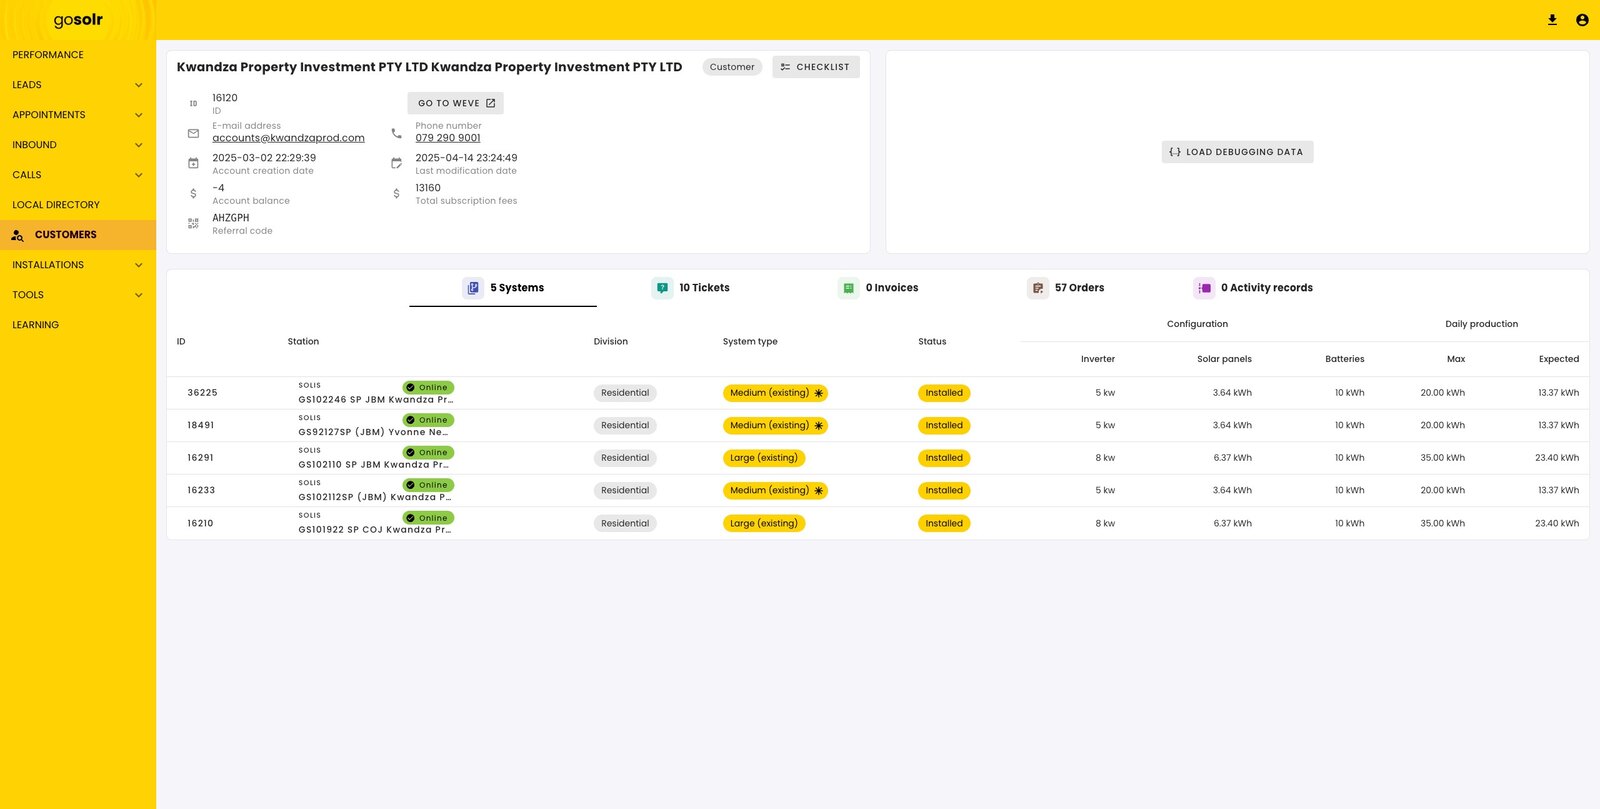
A customer record showing account details and a systems tab listing five installations with division, system type, status, inverter, panels, battery and daily production.
Five systems on one account, each with its own configuration and expected daily production. Multi-site clients are a row count, not a special case.

And everything that went wrong

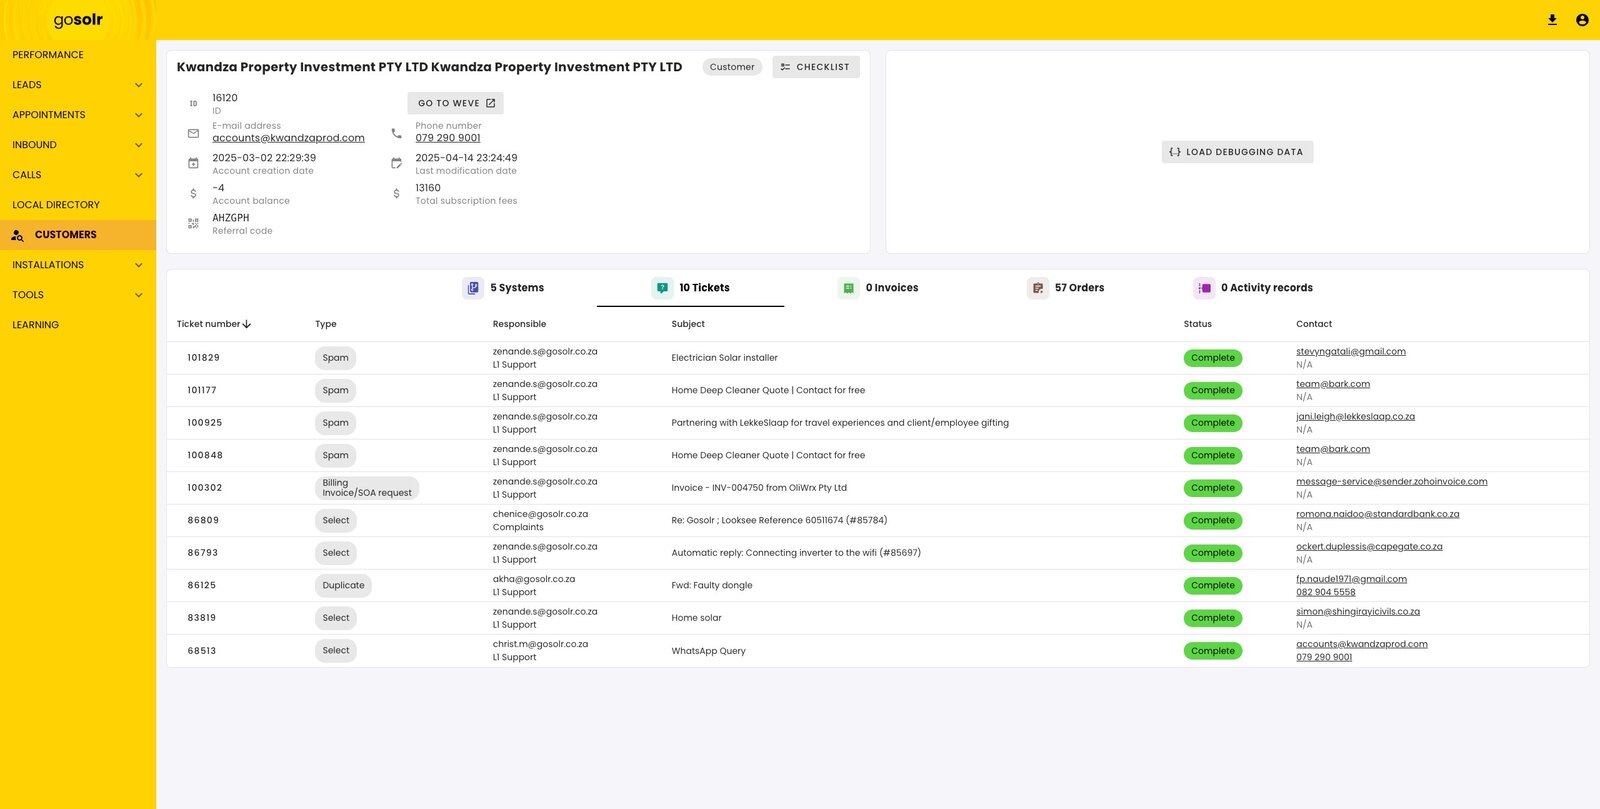
The same customer record on its tickets tab, listing ten support tickets with type, responsible queue, subject, status and contact.
Ten tickets against the same account — typed, assigned, and closed — so the next person to pick up the phone already knows the history.

This is the platform your clients would be running on.

Contact us